
Search the research desk.
Type a market, company or commodity and jump straight into the K2 report that covers it.
K2 Capital is a Hong Kong-based investment firm and a trusted channel to East and Southeast Asian investments, delivering disciplined strategies and customized portfolio solutions.
Opportunity moves across borders. K2 Capital, a trusted channel into East and Southeast Asian investments.
K2 Capital Limited · Hong Kong, China
[ What we do ]
From equities and natural gas to venture capital and franchising, across Mainland China, Hong Kong and Southeast Asia.
Read the research[ Portfolio ]
Funds, ventures and an institute across asset management, artificial intelligence, F&B and education.
Equity, commodity and thematic research from the K2 research team, on markets across Asia and beyond. Selected reports are open to everyone; clients get full access to every report.
Type a market, company or commodity and jump straight into the K2 report that covers it.

Partnerships, advisors, funds and portfolio news from K2 Capital and its companies.
Clients & recognition

[ Portfolio ]
From franchise licensing and F&B ventures to fund raises and AI acquisitions. Hover a row for a preview, select it to read the release.
[ Global Research ]
by K2 Capital Management
Gateway to strategic investment insights across Asia and beyond. Become a client to gain full access to every report.

[ News & Insights ]
by K2 Capital Management
Stay up to date with our latest news and insights.

[ Aether portfolio ]
[ Accelerators, partners and competitions ]
Press releases featuring Oliver Tedja and the firms he co-founded.
K2 Capital is advised by leaders from listed companies in China and from global financial services.

[ Contact ]
K2 Capital Limited, Hong Kong. Tell us what you are working on and the right person will get back to you.
Equity research
Central banks have bought about 1,019t of gold a year since 2022, more than twice the 2010-21 pace, and spent more even as tonnes fell: about $94bn in 2025 against $63bn in 2022. Our flow model puts gold at $4,850 by December 2026 (+12%). We initiate Overweight on Newmont (PT $132), Neutral on Barrick (PT $54) and Wheaton (PT $146), and Underweight on Agnico Eagle (PT $203).
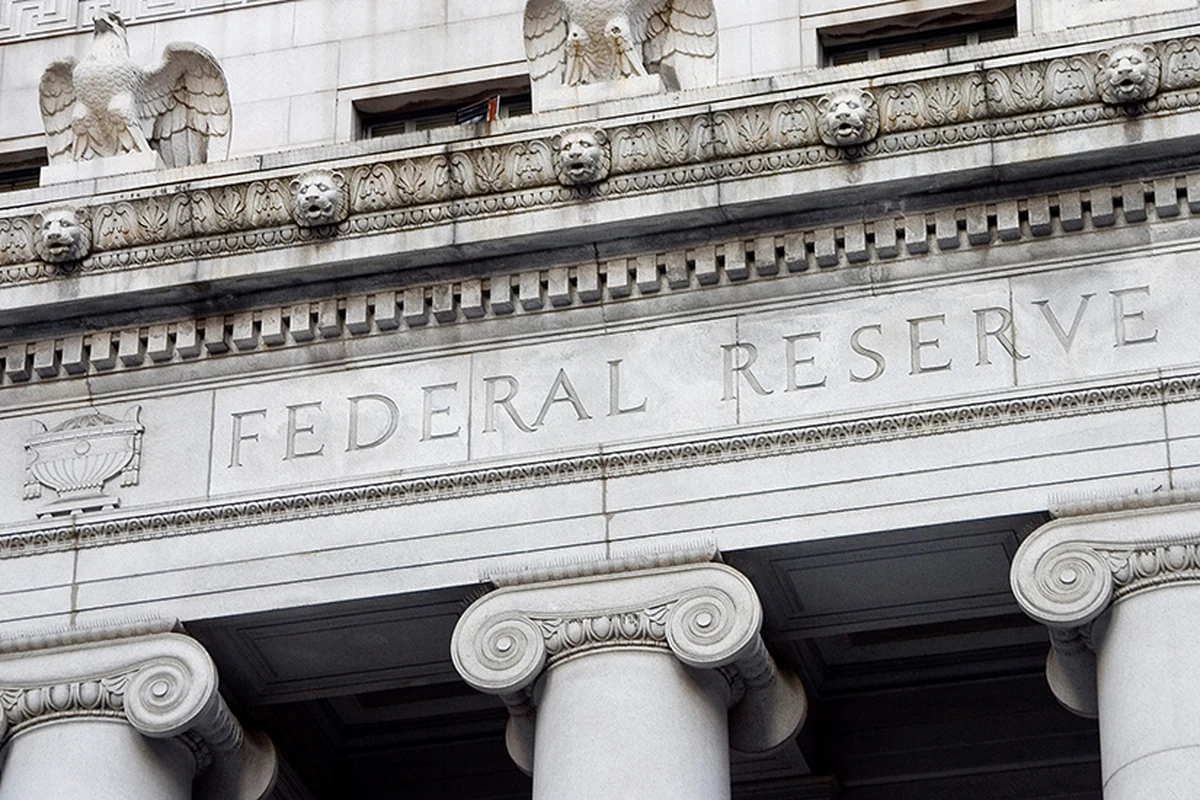
Central banks have bought about 1,019t of gold a year since 2022, more than twice the 2010-21 pace, and spent more even as tonnes fell: about $94bn in 2025 against $63bn in 2022. Our flow model puts gold at $4,850 by December 2026 (+12%). We initiate Overweight on Newmont (PT $132), Neutral on Barrick (PT $54) and Wheaton (PT $146), and Underweight on Agnico Eagle (PT $203).
What’s inside
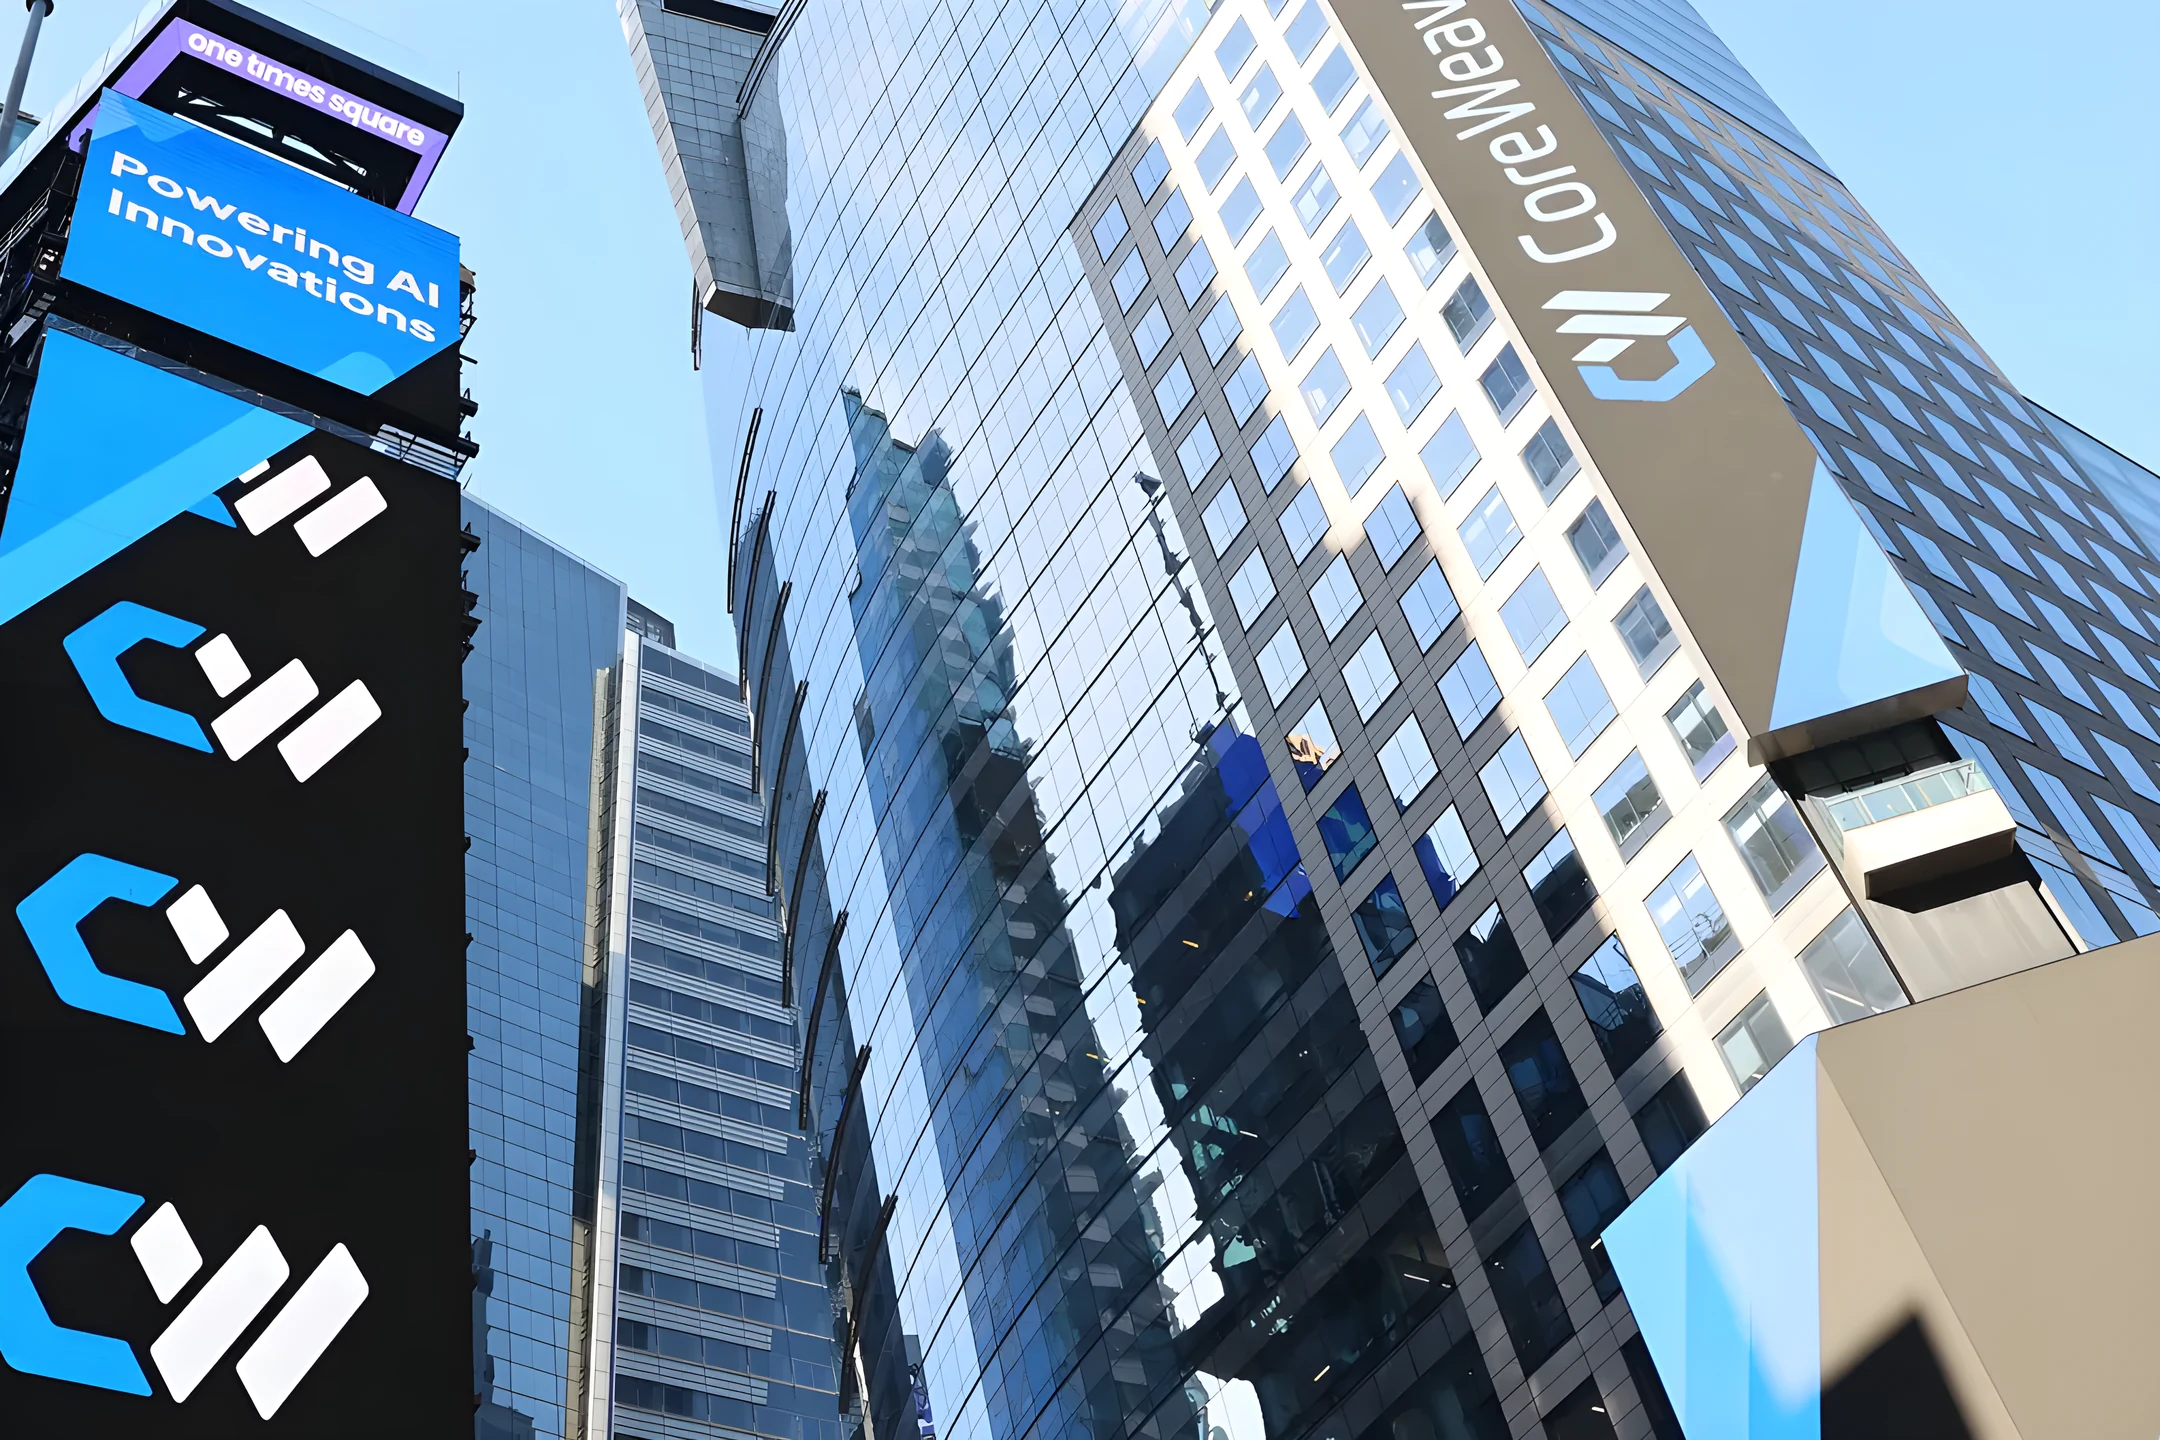
All four neoclouds fell more than the Nasdaq-100’s 4.8% after Microsoft’s and Alphabet’s capex misses, from SpaceX (-7.2%) to IREN (-17.0%), and beta explains each move to within 3pp. We reiterate Overweight on Nebius (PT $207, now +34% upside) and IREN (PT $37), and Underweight on SpaceX (PT $90) and CoreWeave (PT $44).
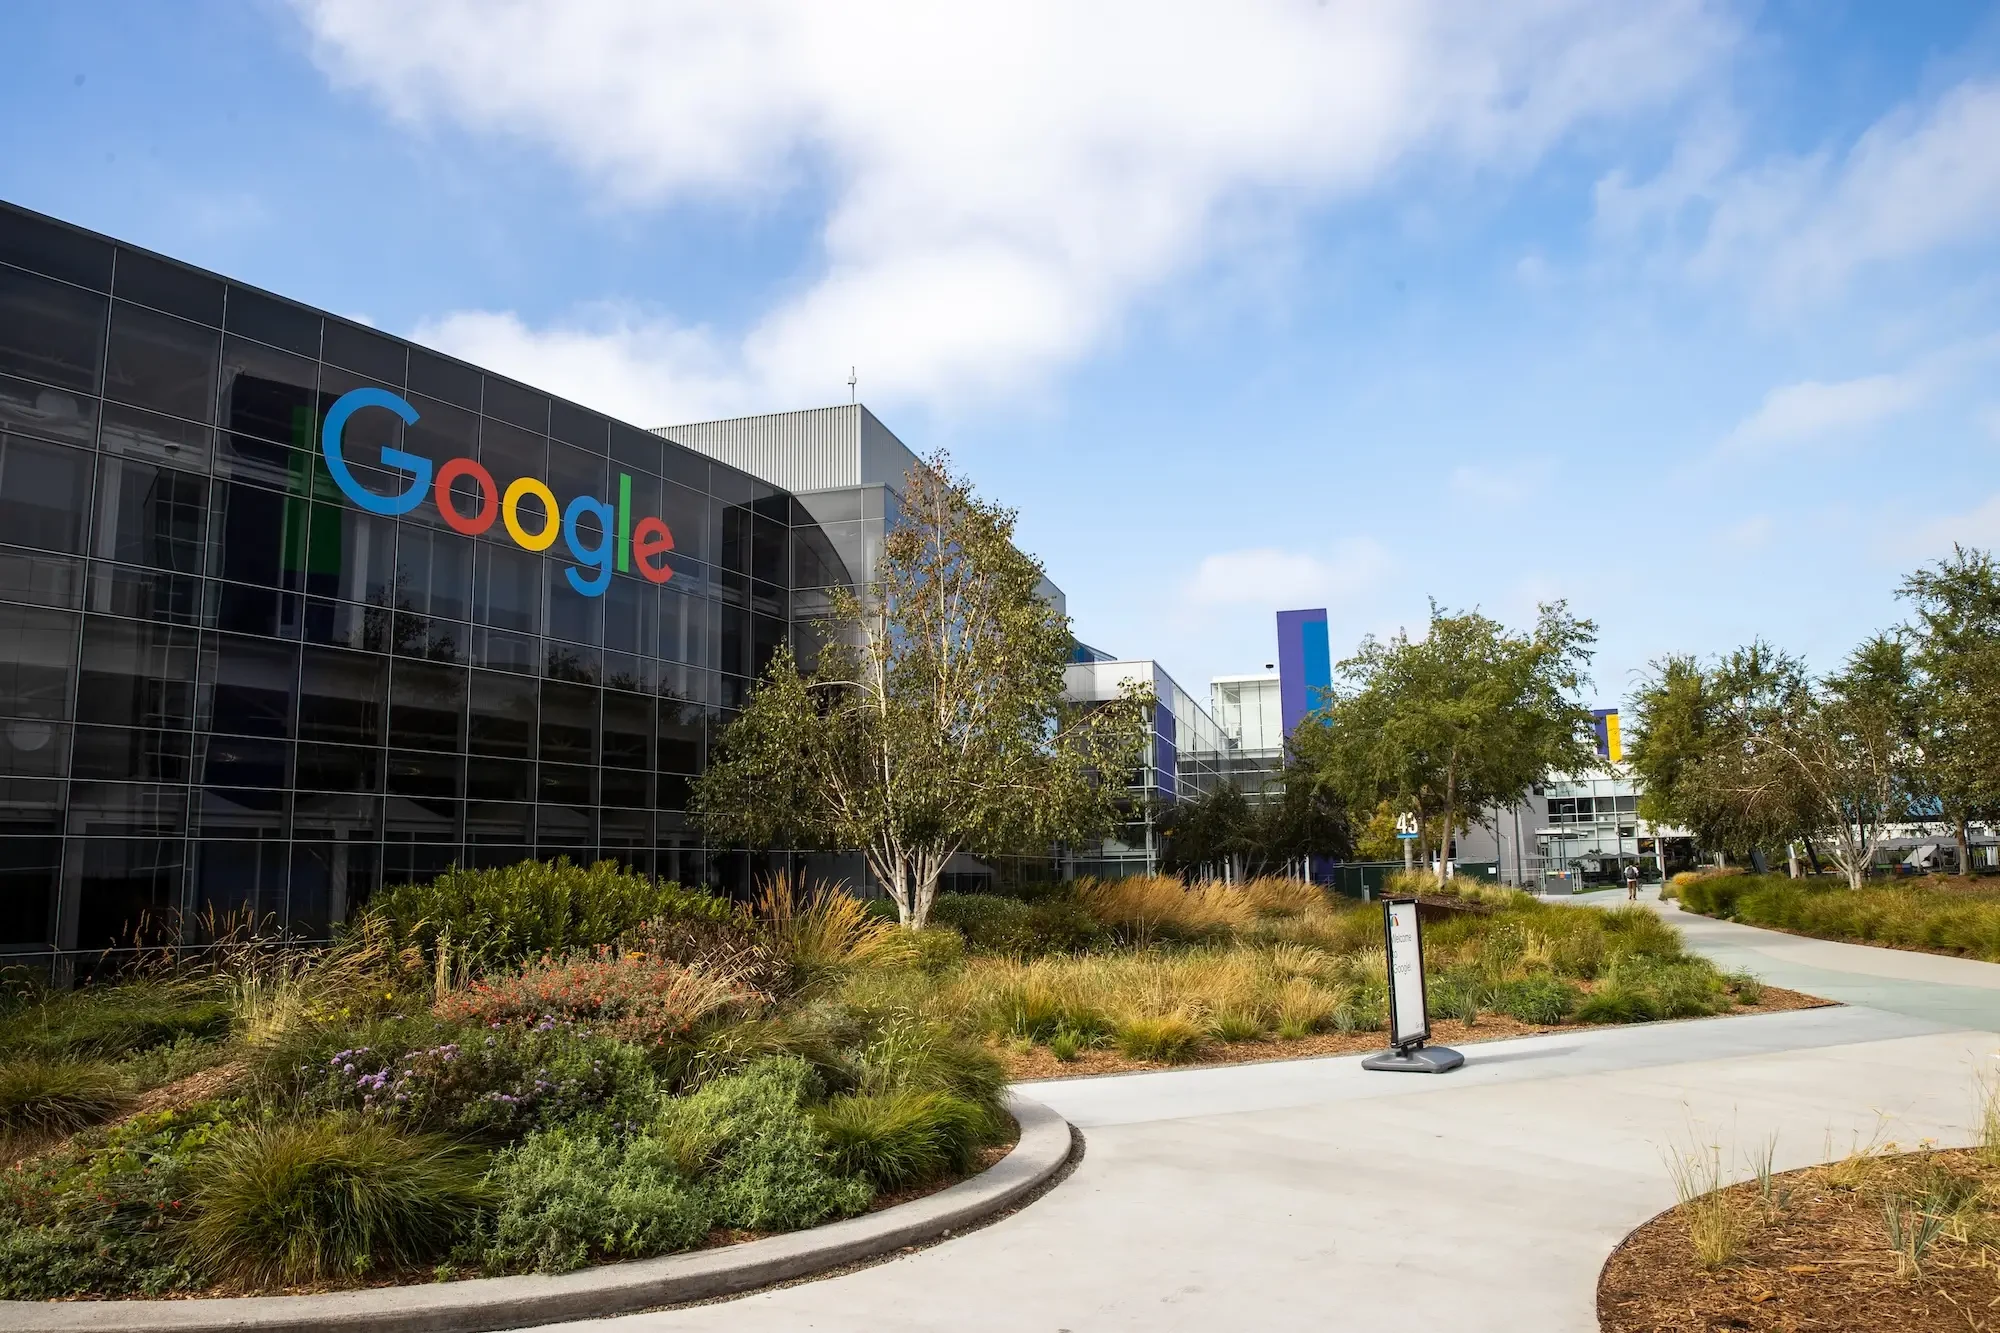
Alphabet lost about $500bn of value on 29 October, falling 12.6% on its own 3Q26 results before Reddit had even reported: Search grew 12% against about 15% expected and paid clicks slowed to 8%. We initiate Neutral on Alphabet (PT $305) and Overweight on Reddit (PT $130).
SpaceX is the best-capitalised neocloud we cover, and the dearest: at $1.97tn the market pays about $1.4tn, or 46x annualised revenue, for its AI segment. We initiate on four neoclouds: Underweight SpaceX (PT $90), Overweight Nebius (PT $207) and IREN (PT $37), and reiterate Underweight CoreWeave (PT $44).